
Canada Income Tax Calculator: Estimate Your Annual 2026 After-Tax Income


Our Canadian income tax calculator estimates your annual and per-pay-period take-home pay using current CRA rates for federal tax, provincial or territorial tax, CPP contributions, and EI premiums. Your province or territory of residence on December 31 matters because it generally determines which provincial or territorial income tax rates apply to your annual tax return. If too much tax comes off your cheques during the year, the CRA refunds the difference after you file, and the final section of this page explains how to fix the cause instead of waiting for the refund.
Note: This calculator estimates your 2026 annual after-tax income using your province or territory of residence on December 31. Any per-pay-period amount is the annual estimate divided by your selected number of pay periods; it is not an exact payroll-withholding calculation.
What Does This Canadian Income Tax Calculator Do?
This calculator estimates annual federal and provincial or territorial income tax based primarily on your province or territory of residence at year-end, applying both federal and provincial tax brackets, and subtracting applicable credits and payroll deductions. It assumes that you live and work in the selected province or territory throughout the year.
To use our calculator, you need to select your province or territory and fill in your earnings, pay period, other income, and deductions for the year. It then applies the relevant federal and provincial/territorial tax brackets to produce a combined result. It also factors in the basic personal amount, CPP contributions, and EI premiums, giving you your take-home pay rather than just the income tax amount.
Employees can use our calculator for many reasons:
- planning their budgets,
- understanding the approximate annual impact of income tax and statutory contributions,
- comparing job offers across provinces and territories,
- estimating how bonuses or vacation pay affect earnings,
- getting ready for tax season to avoid surprises.
Please note: In Quebec, the payroll system includes the QPP, the QPIP, a reduced EI rate, and distinct provincial withholding rules managed by Revenu Québec. For payroll calculations in Quebec, the CRA T4127 does not replace the calculations required by Revenu Québec. If your province of employment differs from your province of residence, CPP/QPP, EI/QPIP and territorial payroll-tax results may differ.
What are the Key Tax Changes that Affect Your Canadian Income Tax Calculation?
The CRA payroll update starting July 1, 2026, does not change the federal tax brackets; it mainly updates payroll calculations and some provincial details. On the payroll side, the contribution limits for the annual CPP, CPP2 and EI earnings limits have increased for 2026, meaning most employees will see slightly higher payroll deductions than in 2025.
Below is a detailed overview of the updated federal tax brackets, the basic personal amount, and the new payroll deduction thresholds that apply to your income tax calculation for 2026:
- The lowest federal tax rate used in CRA payroll formulas is 14%;
- Federal tax bracket thresholds increased for 2026;
- The federal basic personal amount is up to $16,452 for 2026 and is gradually reduced for higher-income individuals, reaching the minimum amount of $14,829 at the top federal threshold;
- The Canada Employment Amount is $1,501;
- The EI maximum employee premium outside Quebec is $1,123.07.
Source: Current year tax rates and income brackets (2026) – Government of Canada
Federal Income Tax Rates and Brackets
Canada uses a progressive income tax system with five federal tax brackets. This means that employees pay higher tax rates only on the income that exceeds the limits of each bracket, not on their whole income. For the full 2026 tax year, the lowest federal income tax rate is 14%, down from 14.5% in 2025 and 15% before the mid-2025 cut.
For the 2026 tax year, the federal tax brackets are:
- 14% on taxable income up to $58,523;
- 20.5% on the portion over $58,523 up to $117,045;
- 26% on the portion over $117,045 up to $181,440;
- 29% on the portion over $181,440 up to $258,482;
- 33% on the portion over $258,482.
In addition to federal taxes, each province and territory in Canada imposes its own income tax with distinct brackets and rates. For most people, the province or territory where you live on December 31 of the tax year decides the provincial or territorial tax rates for that year’s tax return.
Provincial and Territorial Rates for Individuals in Canada at a Glance
Your location significantly impacts the amount of income tax you owe each year, as each province or territory has its own progressive tax rates that increase with your income. These provincial and territorial rates can vary significantly, with a starting rate as low as 4% in Nunavut and a top rate as high as 25.75% in Quebec.
The main factors influencing these differences are the tax bracket structure, surtax regulations (particularly in provinces with multi-layered systems), and the provincial/territorial basic personal amount.
The table below is a high-level comparison only. Provincial and territorial tax systems may include surtaxes, reductions, health premiums, payroll taxes, or credits that are not fully captured by looking only at the lowest and highest marginal rates.
| Province / Territory | Tax Rate | Top Bracket Threshold | Distinctive feature |
|---|---|---|---|
| British Columbia | 5.60% – 20.50% | $265,545 | Bracket indexation paused 2027-2030 |
| Alberta | 8% – 15% | $370,220 | No PST; K5P supplemental credit; 2% indexation cap |
| Saskatchewan | 10.50% – 14.50% | $155,805 | Simple 3-bracket system; BPA boosted by the Saskatchewan Affordability Act |
| Manitoba | 10.80% – 17.40% | $101,200 | Top rate applies at just $101,200 |
| Ontario | 5.05% – 13.16% | $220,000 | Top thresholds unindexed since 2014; Ontario Health Premium applies |
| Québec | 14% – 25.75% | $132,245 | Highest provincial top rate (25.75%); separate system via Revenu Québec’s WebRAS |
| New Brunswick | 9.40% – 19.50% | $193,861 | Low-income reduction with a 3% clawback band |
| Newfoundland and Labrador | 8.70% – 21.80% | $1,141,275 | Highest combined top rate (about 54.80%); BPA increased to an annualized $13,094 for 2026, with a prorated $15,000 applied to pay dates on or after July 1, 2026 |
| Nova Scotia | 8.79% – 21% | $157,124 | First-ever indexation in 2025 (continued at 1.6% for 2026); BPA clawback eliminated |
| Prince Edward Island | 9.50% – 20% | $200,000 | For payroll withholding after July 1, 2026, the CRA uses a 21% prorated rate on income of $200,000 and over |
| Yukon | 6.40% – 15% | $500,000 | Unique fertility and surrogacy tax credit |
| Northwest Territories | 5.90% – 14.05% | $172,346 | A separate 2% territorial payroll tax applies on top |
| Nunavut | 4% – 11.50% | $181,439 | Lowest rates in Canada (4% bottom, 11.50% top, 44.50% combined) |
When reviewing these rates, pay attention to three key factors: how quickly rates increase across tax brackets, how high the top rate is, and the income level at which the top rate applies. For example, a province with a low starting rate but a low cap on its top tax rate will cause middle earners to pay higher taxes sooner than a province where the top tax rate only starts at a much higher income level.
Example of How Provincial and Territorial Tax Differences Affect Your Take-home Pay
To show how provincial and territorial rates affect take-home pay, we compare the estimated annual after-tax income for a gross salary of $75,000 across all 13 provinces and territories.
Note that this comparison uses only the standard basic personal credit, CPP, EI, and federal plus provincial/territorial income tax. It does not account for variations in each jurisdiction’s unique credits, deductions, bonuses, additional income, or special levies unless otherwise noted.
The table below shows how estimated after-tax income can vary by province and territory in Canada:
| Province / Territory | Gross Income | Province / Territory Tax | Federal tax | After-tax Income |
|---|---|---|---|---|
| British Columbia | $75,000 | $3,661 | $8,259 | $57,711 |
| Alberta | $75,000 | $4,010 | $8,259 | $57,362 |
| Saskatchewan | $75,000 | $5,566 | $8,259 | $55,806 |
| Manitoba | $75,000 | $6,337 | $8,259 | $55,035 |
| Ontario | $75,000 | $4,446 | $8,259 | $56,926 |
| Québec | $75,000 | $7,768 | $6,856 | $54,663 |
| New Brunswick | $75,000 | $6,270 | $8,259 | $55,102 |
| Newfoundland and Labrador | $75,000 | $6,635 | $8,259 | $54,737 |
| Nova Scotia | $75,000 | $7,949 | $8,259 | $53,423 |
| Prince Edward Island | $75,000 | $7,056 | $8,259 | $54,316 |
| Yukon | $75,000 | $3,717 | $8,259 | $57,655 |
| Northwest Territories | $75,000 | $3,609 | $8,259 | $56,263 |
| Nunavut | $75,000 | $2,553 | $8,259 | $57,319 |
Note for NWT and Nunavut: The after-tax income figures shown for the Northwest Territories and Nunavut also include the separate 2% payroll tax that may be withheld from employees’ pay in those territories. At a $75,000 salary, this could reduce take-home pay by about $1,500.
As we can see, in every province and territory except Quebec, the federal tax is about $8,259. The differences in the table are mostly due to the provincial or territorial layer and certain payroll deductions. Quebec is different because residents benefit from a federal abatement, which reduces their federal tax to $6,893 due to the province’s separate tax system.
Under these simplified assumptions, estimated take-home pay on a $75,000 salary differs by about $4,300 between the highest and lowest results in this comparison. British Columbia offers the highest take-home pay at about $57,711 due to low tax rates. Other provinces with good take-home pay include Yukon ($57,655), Alberta ($57,362), Nunavut ($57,319), Ontario ($56,926), and Northwest Territories ($56,263).
In contrast, Nova Scotia ($53,423) and Prince Edward Island ($54,316) have the lowest take-home pay due to higher tax rates and lower basic personal amounts. Quebec ($54,663) also ranks among the lower-take-home-pay provinces because of its higher provincial tax rates and additional payroll deductions through Revenu Québec, including the QPP (at 6.3%, versus 5.95% for CPP) and the QPIP employee premium of 0.430%.
Disclaimer: This table provides a simple yearly estimate and should not be treated as an exact calculation of CRA payroll deductions. Some jurisdiction-specific amounts are not fully included. Your actual pay stub may differ because of payroll taxes, health premiums, surtaxes, additional TD1 credits, taxable benefits, employer deductions, or other personal circumstances.
How Provincial and Territorial Taxes Affect Your Annual After-Tax Income
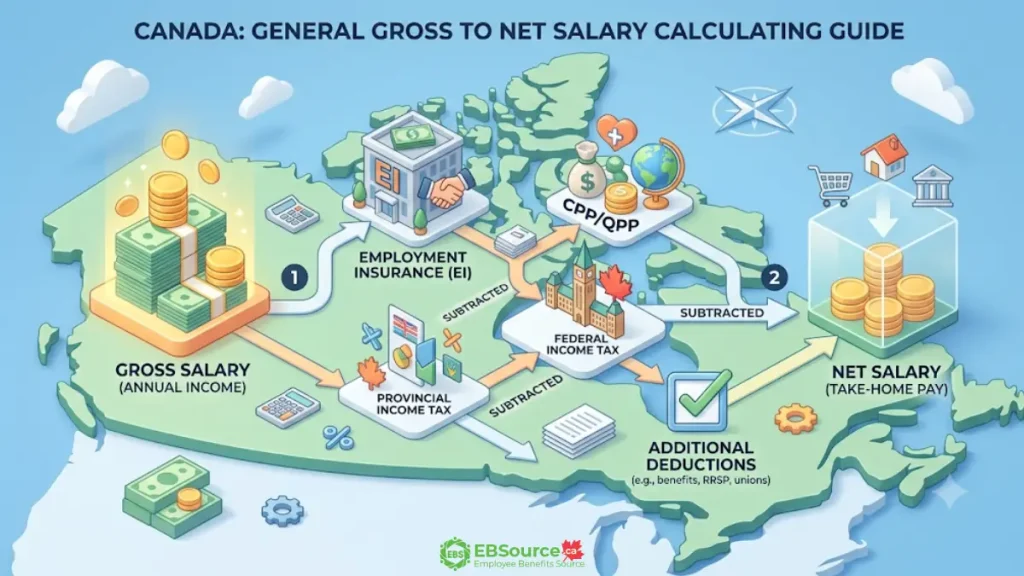
The federal government calculates tax using its brackets, and then your province or territory applies a separate set of progressive brackets to the same taxable income. The total income tax you owe is the sum of both calculations.
When using our 2026 Canada income tax calculator, it is crucial to select the correct province or territory, as doing so affects the entire second layer of your tax calculation. Each province and territory has different tax rates, credits, and premiums, meaning your after-tax pay can differ by thousands of dollars, even with the same salary. If you are comparing job offers across provinces, running the calculator for each location with the same gross salary will quickly show you the differences in after-tax pay.
Additionally, some provinces or territories, such as Quebec and Ontario, have distinctive levies or surtaxes on top of the standard rates. They may not be included in basic estimates, but are important to consider for accurate financial planning.
What Happens if Too Much Tax is Taken from Your Paycheque?
If your total tax withheld exceeds your final tax payable after assessment, the difference is generally refunded, subject to any amounts the CRA is authorized to apply against outstanding debts. The CRA sends back any extra deductions after your annual return is processed. Most people who file online and use direct deposit get their refunds in about two weeks, while paper returns can take eight weeks or longer. If withholding is consistently too high, first check your TD1. For eligible deductions or credits that are not reflected on the TD1, you may need CRA authorization to reduce deductions at source, generally requested using Form T1213. Remember to claim all credits you qualify for, like spousal, dependent, or tuition amounts, since these can lower your withholdings immediately.
A large refund can result from excess withholding, refundable credits, deductions claimed on your return or other adjustments. If excess withholding is recurring, review the cause before changing payroll deductions.
If your income changes during the year, it can affect the amount of tax taken from your pay. For example, if you lose your job, take unpaid leave, or work fewer hours, you might end up paying too much tax. To get back any extra tax, file your tax return as soon as you can.
Why Does Your Pay Stub Not Match Our Calculator?
A difference does not by itself show which figure is wrong. Check your province of employment, TD1 claims, taxable benefits, year-to-date CPP/EI amounts, bonus timing and employer deductions before comparing the estimate with your pay stub.
The list below outlines the most common reasons your pay stub may differ from our estimate, and what is happening behind each one:
TD1 credits beyond the basic personal amount: Our calculator assumes you claim only the basic personal amount. If you claimed the spousal, eligible dependent, tuition, disability, age, or caregiver amount on your federal or provincial TD1, less tax is withheld than our estimate shows. An outdated TD1 has the opposite effect.
Taxable benefits: Some employer-provided benefits count as taxable employment income and can increase the income tax withheld from your pay. Common examples include employer-paid group life insurance premiums, personal use of a company vehicle, and certain parking benefits, though the rules and exceptions vary by benefit type.
Additional voluntary tax: If you asked your employer to withhold a fixed extra amount each pay period, your stub will show more tax than our estimate, which does not account for your opting in.
Mid-year changes: Changes to salary, job status, or pay frequency can disrupt steady-income calculations and cause discrepancies on your pay stubs.
Other employer-specific deductions: Garnishments, benefit premiums, professional dues, or charitable donations taken through payroll reduce your take-home pay without changing the tax calculation.
If your stub differs consistently rather than just once, it is worth checking that your TD1 form is current, asking your payroll department for a breakdown of any taxable benefits, and using the CRA’s PDOC for the closest possible match to your employer’s own software.
Does This Income Tax Calculator Include Employee Benefits?
This calculator includes statutory payroll deductions such as CPP/QPP contributions and EI premiums, but it does not automatically account for employer-specific taxable benefits or employee-paid benefit premiums.
When an employer-provided benefit is taxable, its value is added to your taxable employment income. Depending on the benefit and how it is provided, it may also affect CPP/QPP contributions or EI premiums. Employee-paid health, dental, disability or other benefit-plan premiums may separately reduce the take-home amount on your paycheque without reducing your taxable income.
As a result, the calculator may show more take-home pay than your actual pay stub. Review any taxable-benefit amounts and benefit-premium deductions on your pay stub when comparing the two. Learn more about the tax treatment of employee benefits in Canada.