


Many Canadian employee benefits plans typically cost between $80 and $350 or more per employee each month. However, the amount varies by plan and whether employees choose single or family coverage.
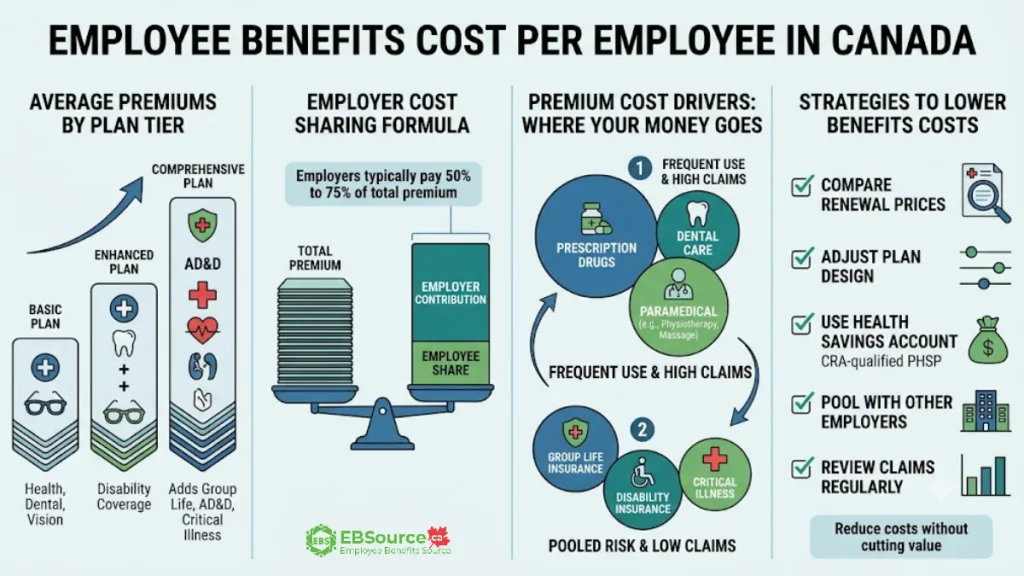
To understand where the money goes, it helps to know that your premium is actually made up of different types of coverage, and a few of them, mainly prescription drugs, dental, and health services like physiotherapy, make up most of the cost. The shared-risk parts like group life insurance, AD&D, and critical illness are cheaper and more stable because claims are rare, even though the payments can be large.
Many employer-sponsored plans use some form of employer-employee premium sharing, such as 50/50, 75/25, or full employer-paid coverage. Do not treat any split as a Canada-wide legal minimum. Confirm the insurer’s employer-contribution, participation, waiver, and eligibility rules before setting payroll deductions.
On this page
How Much Do Employee Benefits Cost Per Employee in Canada?
A practical small-business planning range is $80 to $350+ per employee per month in total premiums. Where a quote falls within or outside that range depends on several factors, including:
- the benefits included and their limits;
- single, couple, or family coverage;
- the number, age profile, location, and occupations of employees;
- claims experience and the insurer’s credibility or pooling method;
- the employer-employee contribution split; and
- fees and provincial taxes included in or added to the quote.
Note: These ranges reflect differences in plan scope, group size, coverage mix, and whether a figure captures the total premium or the employer’s portion. They exclude statutory payroll costs such as CPP and EI contributions.
So treat the published numbers below as planning ranges rather than definitive averages, and always confirm what each figure includes before comparing it to your own quote.
Planning Benefits Cost Per Employee by Plan Design
Group plans in Canada usually fall into three tiers that build on each other. According to Aligned Insurance, a basic plan covering health and dental runs about $80 to $150 per employee per month; an enhanced plan that adds short- and long-term disability and higher limits falls between $150 and $250 per month; and a comprehensive plan, which adds group life, accidental death and dismemberment, and critical illness on top of the enhanced tier, can cost $250 to $350 or more.
As you move up the tiers, remember that the life, AD&D, and critical illness premiums added at the top tier are treated differently for tax than health and dental, a point covered in the cost-sharing section below.
The table below uses tier ranges published by Aligned Insurance, quoted as total monthly premium per employee before any cost-sharing:
| Plan tier | Typical inclusions | Monthly cost per employee (CAD) | Annual cost per employee (CAD) |
|---|---|---|---|
| Basic (health and dental) | May include extended health care, prescription drugs, preventive dental, and often vision with lower annual maximums | $80 to $150 | $960 to $1,800 |
| Enhanced (adds disability) | May include everything in Basic, plus short- and/or long-term disability, higher drug and dental maximums, broader paramedical coverage, and often an EAP | $150 to $250 | $1,800 to $3,000 |
| Comprehensive (adds life, richer limits) | May include everything in Enhanced, plus group term life, AD&D, and critical illness, sometimes paired with an HCSA | $250 to $350+ | $3,000 to $4,200+ |
Planning Benefits Cost Per Employee by Coverage Tier (Single vs. Family)
Single, couple, and family rates can differ substantially. Family coverage is often more expensive than single coverage, but there is no reliable universal multiplier. The relationship depends on the carrier, plan design, province, and group profile.
For example, if a proposal shows a $150 single rate, do not assume that family coverage will be exactly 1.5 or 2 times that amount. Request the actual single, couple, and family rates and calculate the total using the expected enrolment mix.
Use this formula for each coverage tier:
Monthly premium for a tier = Number enrolled in that tier × Monthly rate for that tier
Then add the tiers together and multiply by 12 for an annual estimate.
Budgeting action: Prepare a census that identifies eligible employees, expected waivers, and single, couple, and family enrolments before requesting quotes. A blended "average employee" rate can materially understate the budget when family participation is high.
Methodology note
The cost ranges in this article are based on published Canadian broker estimates and a Canadian small-business survey. There is no single government-published national average that applies to every group plan. Every benchmark should therefore be labelled as one of the following:
- total premium or employer-paid cost;
- monthly or annual;
- per enrolled employee or per eligible employee; and
- health-and-dental-only or a broader package that includes life and disability.
How Each Coverage Contributes to Your Total Premiums
Your premium is not one price; it is a bundle of separate coverages, and a small number of them drive almost all of the cost. Knowing this split tells you where your money actually goes and, later, where cost control is worth the effort.
The coverage types are split into two main groups:
The first group includes services that employees use often, mainly prescription drugs, dental care, and paramedical services. These areas usually have big claims and are filed regularly, which can affect a small group’s premiums and renewal rates.
The second group includes pooled-risk options like group life insurance, AD&D insurance, and group critical illness coverage. These are usually cheaper per person and remain steady over time because claims occur rarely, even though the payout can be large.
Industry claims data reflect the same pattern. Of the $53.3 billion in health benefits Canadian insurers paid in 2024, including $16.6 billion for prescription drugs, according to CLHIA.
However, no template can cover all factors. Insurance companies set prices for each coverage based on many factors.
How the $200 Premium Splits by Component
To show the dollar proportions, the table allocates the same $200-per-employee-per-month planning figure used earlier across the components.
| Coverage component | What it pays for | Where to find the amount in your quote | Illustrative cost (on a $200 monthly plan) |
|---|---|---|---|
| Prescription drugs | Medications not covered provincially | Extended health/drug line on the rate sheet | $70 |
| Dental | Cleanings, fillings, major work | Dental line | $38 |
| Extended health (paramedical, vision) | Physiotherapy, massage, psychology, vision | Extended health / paramedical line | $47 |
| Disability (STD and LTD) | Income replacement when unable to work | STD and LTD lines | $27 |
| Group life and AD&D | Lump sum on death or serious injury | Life / AD&D line | $10 |
| Critical illness | Lump sum on diagnosis | CI line, if included | $5 |
| EAP | Confidential counselling and support | EAP / admin line | $3 |
| Total | $200 |
Note: This modelled split is intended to illustrate the relative weight of each coverage component rather than actual market rates. Your actual figures depend on plan design, group demographics, and province/territory. Use the $200 table below only as an illustrative model, then replace it with the actual rate lines from your insurer’s quote.
Tax treatment can also change the true cost of each component to both the employer and the employee, and the rules differ by coverage type; the cost-sharing section below covers this benefit by benefit.
How Employer-Employee Cost Sharing Works
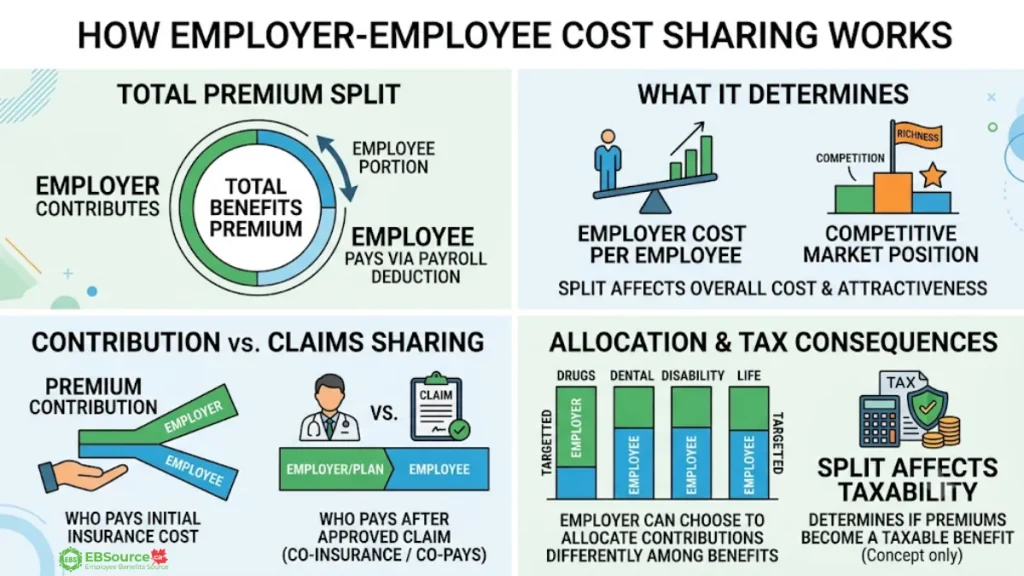
Cost-sharing directly affects the employer’s cost per employee. In most industries, employers cover between 50% and 75% of total premiums or another employer-defined split. In addition, fully employer-paid benefits are more prevalent in larger companies and for senior roles, so the cost-sharing arrangement you choose can also indicate your competitive positioning.
Here is the breakdown of the employer’s costs per employee on the same illustrative $200 total monthly premium used above:
| Cost-sharing model | Employer’s monthly cost per employee | Employer annual cost per employee |
|---|---|---|
| 100% employer-paid | $200 | $2,400 |
| 75/25 split | $150 | $1,800 |
| 50/50 split | $100 | $1,200 |
For a 10-person company, switching from fully employer-paid coverage to a 75/25 cost split saves $6,000 a year, and a 50/50 split saves $12,000 a year, on the illustrative $200 premium above.
Note that premium contribution sharing differs from co-insurance and co-pays, which determine how the costs of approved claims are split between the insurance plan and the employee.
Pro tip: EBSource advisors recommend that employers pay at least half of total health plan costs to demonstrate their commitment, since many insurance companies require a minimum payment of about 50% of premiums. However, contribution and participation rules are set by the insurer and the group contract. Before announcing payroll deductions, obtain written confirmation of the carrier’s employer-contribution, participation, waiver, and eligibility requirements. Do not treat a 50% employer contribution as a Canada-wide legal or insurer-wide minimum.
How Your Cost-Sharing Split Affects Tax
Changing the employer-employee premium split typically does not affect the total premium charged by the insurer. Instead, it changes how much the employer pays, how much is deducted from employees’ paycheques, and whether the employer-paid portion creates a taxable benefit or affects the taxation of future benefit payments.
When reviewing federal payroll tax, examine each coverage line individually. Employer contributions to a qualifying Private Health Services Plan are typically not considered a taxable benefit. However, employer-paid group term life insurance is taxable.
Employer contributions to group sickness or accident coverage, including AD&D or critical illness coverage, are generally taxable unless they are related to a qualifying periodic wage-loss replacement plan.
A wage-loss replacement plan must be a group arrangement that replaces employment income periodically and meets the requirements set by the CRA. An employee-pay-all arrangement is not automatically comparable to an employer-funded plan. Check the contract details and how premiums are paid with your payroll provider before making deductions or T4 reports.
Source: Premiums and contributions to insurance plans – Government of Canada
Example: Allocating a 75% Employer Contribution by Coverage
If the total premium is $200 per employee per month and the employer covers 75% ($150), the employee pays the remaining 25% ($50). However, the employer can allocate its $150 contribution differently among benefits, such as allocating more to health and dental while passing the full cost of long-term disability to the employee.
Even though the total premium would remain $200, the allocation could produce a different tax outcome from applying the same 75/25 percentage to every benefit. Employers should ask the insurer to show the premium for each coverage separately before setting the payroll deductions.
Québec Exception
In Québec, Québec payroll treatment differs from federal treatment. Employer contributions to a group insurance plan, including a Private Health Services Plan, are a Québec taxable benefit. For PHSP coverage, report the benefit in boxes A and J of the RL-1 slip. Box G may also apply, depending on the benefit and payroll calculation. Use current Revenu Québec guidance and your payroll provider’s Québec configuration before processing deductions.
Payroll note: Employer-paid taxable insurance benefits may require payroll withholding, employer contributions and information-slip reporting. Employee-paid PHSP premiums may be reported under T4 code 85, although the CRA identifies this reporting as optional. Employers should confirm the allocation and reporting treatment with their insurer, payroll provider or tax professional before implementing the cost-sharing arrangement.
How to Calculate Your Benefits Cost Per Employee
To find the per-employee cost of benefits, divide the total annual cost of employer benefits by the average number of employees covered. This will give you the monthly and annual cost per employee. It’s important to get the inputs right, as mistakes are common in first-time employee benefits budget versions, and the number of employees affects the results.
There are two valid versions of the formula, and they answer different questions:
Formula 1 measures what coverage costs for the people actually in the plan:
Cost Per Enrolled Employee = Total Annual Employer Benefits Cost / Average Number of Enrolled Employees
Formula 2 is used for workforce budgeting, since it spreads the cost across everyone who could join, including employees who waive coverage:
Cost Per Eligible Employee = Total Annual Employer Benefits Cost / Average Number of Eligible Employees
How to Get the Inputs Right
To make either formula accurate, here is what you need to keep in mind when determining each component:
- Total Annual Employer Benefits Cost: Add up 12 months of premiums for health, dental, life, and disability coverage, plus any employer-funded reimbursements, administrative fees, and taxes. Subtract employee payroll deductions and any refunds. Remember, employee contributions are not counted as employer expenses.
- Headcount: Use the average number of enrolled or eligible employees throughout the year rather than the year-end count, as this provides a more accurate figure.
- Rate Blending: Build your premium total based on the actual mix of single versus family coverage, rather than using a single rate for both.
- Statutory Costs: Do not include costs like CPP and EI unless you are specifically measuring total compensation costs.
Sample Benefits Cost Per Employee Calculations
The easiest way to understand the formula is to see it applied in real examples. Each example below isolates a single input that trips up most first-time budgeters.
Example 1: Single-Versus-Family Blending (10-Person Firm)
In an enhanced-tier sample plan, the individual rate is $150 per month, and the family rate is $330 per month. The annual premiums are calculated as follows:
(5 × $150 + 5 × $330) × 12 months = $2,400 × 12 = $28,800.
Apply your cost-sharing split to that total in one step; at 50/50, the employer share is $14,400, or $1,440 per enrolled employee per year ($120 per month).
If you had planned your budget using only the single rate of $150, your estimated employer share would have been 10 employees × $150 × 12 months × 50% = $9,000. That budget would be $5,400, or 37.5% less than your actual cost. So the mix of enrolled employees, not just the main rate, is what determines your budget.
Example 2: Enrolled Versus Eligible Employees (100-Person Firm)
Consider a company with 100 employees paying an average premium of $180 per enrolled employee each month. 10 employees chose not to have coverage, so 90 are enrolled. The annual premium is 90 × $180 × 12 = $194,400; with the employer covering 80%, the employer pays $155,520.
That one cost divides into two different per-employee figures depending on the question you are asking:
- Cost per enrolled employee: $155,520 ÷ 90 = $1,728 per year, or $144 per month. This is your true unit cost for the people actually in the plan.
- Cost per eligible employee: $155,520 ÷ 100 = $1,555.20 per year, or about $129.60 per month. This is the right figure for budgeting across the whole workforce.
Neither figure is wrong, but quoting one without saying which denominator you used can create a 10% discrepancy, so always specify which you mean.
Your decision: Use the per-eligible number to divide today's costs among all eligible employees, and check the per-enrolled number to see the real cost per person. If you expect more people to enroll, change your model to show that rather than assuming costs will stay the same. More enrollees will raise the total premium.
How to Lower Benefits Cost Per Employee Without Cutting Value
To reduce employee costs while maintaining coverage, consider these five strategies: compare renewal prices with market rates every few years, adjust your plan to eliminate unnecessary expenses, use a health savings account, collaborate with other employers, and review your claims regularly.
Test Your Renewal Pricing Against the Market
The highest cost you can control at renewal is a price increase not supported by your claims. To keep prices competitive, check your employee data and claims history every two to three years. Doing this, even if you keep the same group insurance provider, helps keep prices down and makes it harder for insurers to raise prices without a good reason based on your claims.
Yet, checking your insurance policy does not always save money. Constantly looking for new options every year can create paperwork issues or lead you to swap a short-term low rate for future uncertainty. Use the review to confirm the price is reasonable, not simply to switch carriers.
When it’s time for renewal, here are five warning signs that indicate an increase may be worth challenging before you accept it:
- Increase Without a Workup: the renewal does not match the carrier’s trend assumption, your claims history, credibility, pooling charges, demographic changes, and plan updates. Remember, national medical trend estimates are only budgeting tools and not forecasts for your specific group.
- Lack of Clarity in Workup: the carrier will not give a detailed report of claims history, trend information, and pooling fees.
- Rising Pooling Charges: pooling fees are going up faster than the claims they are meant to cover.
- Single-Claimant Impact: one big claim is causing the whole renewal increase, and no stop-loss option has been discussed.
- Fee Creep: administrative fees are going up without clear notice or explanation.
Adjust Plan Design to Remove Avoidable Claims Cost
Specific design changes are cost controls, not a full plan redesign, and each should be judged only by its cost effect and related trade-offs. Here is how each control might affect costs and its main trade-offs:
- Generic and biosimilar policies can lower drug claims by guiding patients toward equally effective, cheaper options. A compromise is to set medical exception rules to ensure patients who really need the original medicine are not forced to switch.
- Adding co-pays or limits on visits for paramedical services can help reduce use and lower related insurance costs. But this might make employees pay more and make it harder for them to get care, so these changes should be made carefully.
- Setting a shared annual limit for all paramedical services can help keep costs down across different providers. But a single type of service could quickly exhaust the shared limit.
- Reasonable and customary limits set a maximum charge based on common provincial fees, helping to control unusually high costs. Explain clearly how the insurer sets these limits and inform employees to avoid unexpected gaps in coverage.
Before changing the plan, estimate how it will affect employees. A lower premium is not always better if it causes high out-of-pocket costs or reduces disability coverage.
Use a Health Spending Account for a Capped Liability
An HSA can add to insurance coverage but does not replace group life insurance or group disability insurance. Reimbursements are usually tax-free federally when the arrangement qualifies as a Private Health Services Plan under CRA rules.
Because the amount is limited, your highest cost is predictable from day one, making it easier to plan your employee benefits cost than with unlimited insured coverage. However, the actual cost depends on factors like how the plan is funded, claims made, management fees, taxes, and rules about unused amounts. Keep in mind that fees may apply beyond what employees claim.
The main downside is that an HSA reimburses expenses instead of providing insurance protection. This means it does not cover very large or unexpected claims like group insurance does. Companies should create a written plan for setting up a corporate Healthcare Spending Account, explaining who can join, which employee groups are eligible, the plan details, amounts given, and how claims are handled.
Pool With Other Employers to Stabilize a Small Group’s Cost
A pooled or block arrangement shares claims experience among several employers instead of setting your small group’s price based only on its limited past data. For small groups, pooling can stabilize renewals and reduce the extra fees insurers add because of limited claims data.
However, while it helps keep costs steady, it does not promise the lowest price. The main downsides are that you might have less ability to customize, less access to your group’s claims history, and fewer chances to benefit if you have a very good claims year. Make sure to ask how rates are set, what coverages are part of the pool, if your claims affect your renewal, and what information you will get when it’s time to renew.
Review Claims as Often as Credible Data Allows
Regular reviews of combined claims let you spot new cost patterns early, based on how often your group size allows. Specifically, larger groups can get reliable reports every three or six months that show early patterns in drug use, extra medical services, and disability claims. This gives time to make needed changes.
Mental health is a major cost factor; for example, Sun Life said it made up 40% of long-term disability claims for women and 30% for men. Getting care early and having organized disability support can help reduce how long these claims last.
Note that very small groups might not get detailed information because the data may not be reliable enough or could accidentally reveal who made the claims. So, they only get combined information. Remember that no single action will ensure a lower renewal cost.
How to Decide Whether Higher Benefits Costs Are Worth It
Before spending more on benefits, do four checks: first, compare the costs with how much employees value the benefits; second, figure out turnover costs and compare them to the extra costs of a better plan; third, make sure there are clear signs for improving the plan; finally, ask employees about trade-offs instead of just a wish list before deciding on spending.
Check 1: Weigh the Cost Against How Much Employees Value Benefits
The 2023 Blue Cross Small Business Benefits Study surveyed 2,086 Canadian small-business decision-makers and employees (small business defined as fewer than 100 employees). In it, 49% said they would choose benefits over a raise, 36% preferred health benefits to a $40,000 raise, 80% checked a company’s health benefits before accepting a role, and 76% of employees without benefits said they would leave for a job that offered them benefits.
These are stated preferences from one survey, not proof that a plan has a $40,000 cash value or that the same result applies to your workforce. Use them as a reason to ask your own employees.
Benefits also help attract and retain talent through protection employees do not see until they need it: disability and life coverage keep affected employees connected to their jobs and shield the business from the cost of losing them, which is part of the value even when no claim is made.
Check 2: Run the Retention Math With Your Own Numbers
To estimate the cost of a recent resignation, consider recruiting fees, vacancy time, overtime or contractor coverage, onboarding, training, and manager time. Then, compare this total with the yearly extra cost of improving the benefits plan, not the full cost of the whole plan.
Keep in mind that preventing one resignation does not always make the change cost-effective. The value of this investment depends on the specific job, the real reasons the person left, and whether the benefit changes would have kept that employee. Unlike a one-time offer to keep someone, better benefits help protect all employees.
Check 3: Confirm the Signals Point to Enriching the Plan
Base the decision on evidence rather than trends or what competitors do. Investigate when two or more of these appear together:
- Losing candidates at the offer stage: competitors’ packages are resetting expectations in your talent market.
- Exit interviews citing benefits or family coverage: gaps in the plan are already costing you people.
- Key-person dependency: disability or life coverage protects both the business and the employee.
- Wage pressure you cannot meet: benefits can deliver value that a salary increase you cannot afford would not.
- Outgrowing informal reimbursement: ad hoc reimbursements become inconsistent and hard to administer as you grow.
Your decision: treat these as signals to investigate, not a formula. When two or more appear at once, confirm what to add with the survey below before spending.
Check 4: Survey Employees Before You Spend More
Insurance has value even when employees never claim, particularly for disability and life coverage. Still, a survey confirms whether more spending is worth it and which trade-offs employees actually prefer. Ask them to rank choices rather than collect a wish list:
- higher drug coverage versus a higher dental maximum;
- an HCSA versus richer insured health and dental benefits;
- more mental health coverage versus broader paramedical coverage;
- better family coverage versus a lower employee contribution; and
- richer short-term benefits versus stronger long-term disability protection.
Explain the purpose of insurance first, since employees may prefer benefits they expect to use soon and undervalue low-frequency protection such as disability.
Once you know what your team values, you can decide what belongs in your employee benefits package for small businesses and only then compare employee benefits providers against that specification.
Disclaimer: This article provides general benefits-budgeting information for Canadian employers. It is not tax, payroll, legal, insurance, or actuarial advice. Premiums depend on plan design, employee demographics, location, claims, pooling, insurer underwriting, taxes, fees, and cost sharing. Confirm current rates and payroll reporting with your insurer, broker, payroll provider, or tax advisor before changing the plan.